


Most market notes are useless—traders don’t have time for padding.
This short guide shows a strict template that gets a trader from headline to order in under 30 seconds.
You’ll learn the five-step framework: headline, key levels, catalyst with timing, trade instruction, and conviction, plus precise word budgets and timestamp rules.
If you’ve ever chased a breakout, you know how that ends.
Thesis: concise commentary must give exact prices, clear triggers, and explicit risk so traders can act or step back without guessing.
Overview of Concise Market Commentary for Traders

Concise market commentary is a short update that helps traders make decisions without wading through paragraphs of filler. It cuts straight to what changes a trade right now: price levels, catalysts, entry and exit zones, explicit triggers. Traders need to scan these in 5 to 30 seconds, grab the key levels, and decide whether to act or wait.
The standard structure uses a one-line headline, 2 to 4 bullets, and exact numeric levels. Alerts run 8 to 20 words. Intraday notes run 30 to 80 words. Daily wraps run 150 to 300 words. Every update carries a timestamp like “2026-06-14 09:15 ET” so you know exactly when the data was captured. Support and resistance levels use clear labels like S1, R1, S2, R2, always paired with exact prices and timeframes. “S1 1.0720 (daily), R1 1.0850 (intraday).”
Trader clarity means replacing long sentences with one actionable instruction per bullet. Instead of “It might be a good idea to consider entering above 1.0850 if the price holds,” the commentary reads “Entry 1.0850, stop 1.0820, target 1.0900, 4-hour horizon.” Exact price levels and explicit risk instructions turn passive observation into tradeable structure.
Core attributes of concise commentary:
- Length discipline – Alerts 8 to 20 words, intraday notes 30 to 80 words, daily wraps 150 to 300 words
- Timestamping – Every update carries date, time, and timezone (e.g., 2026-06-14 09:15 ET)
- Numeric precision – Indices to 2 decimals, percentages to 1 decimal, exact support/resistance levels
- Structured trade rules – Entry, stop, target, horizon, and confidence percentage in every setup
- Labeled levels – Use S1/S2 and R1/R2 tags paired with timeframe (intraday/daily/weekly)
Pros and Cons of Concise Market Commentary Formats

Brief market notes reduce reading time to 10 to 30 seconds and strip out everything except price levels and catalysts that directly affect your next order. An alert can be assembled in under 2 minutes, letting you publish fast during volatile sessions. Short commentary formats that run 75 to 150 words allow space for 3 key levels, a trade trigger, stop, target, and a quick risk note without bloating the message.
Over-compression can omit necessary risk disclosure or strip out context that prevents misinterpretation. A 10-word alert like “SPX 4,300, buy above 4,310” may miss the stop level or timeframe, leaving you guessing whether it’s a scalp or a swing trade. Excessively tight formats also risk skipping catalyst timing, which can leave traders entering a setup minutes before a high-impact data release.
| Pros | Cons |
|---|---|
| Clarity – Readers scan in 3 seconds and know the action | Context depth – May omit background or secondary scenarios |
| Production time – Alerts assembled in 1 to 3 minutes | Risk detail – Tight formats can skip position size or invalidation |
| Trader focus – Only actionable triggers and levels included | Event timing – Quick notes may not list exact catalyst times |
| Readability – 10 to 30 second read fits active trading windows | Overload risk – Too many short alerts can flood channels |
Balancing brevity with precision means including at least one explicit stop and one target with every trade idea, tagging levels with timeframes, and listing catalyst timing even in the shortest updates. The goal isn’t to write less for the sake of speed but to write exactly what you need to place an order confidently and manage risk correctly.
Components of a Concise Market Snapshot
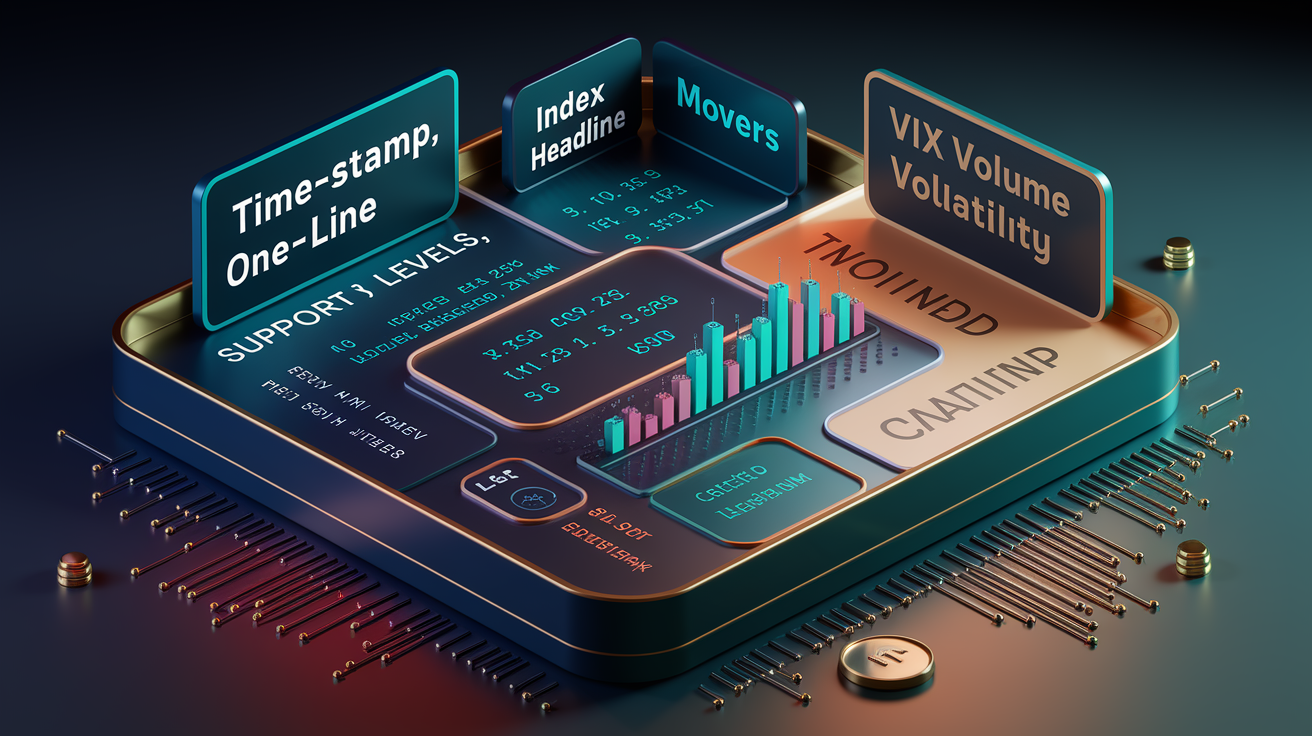
A complete snapshot starts with a timestamp so you know whether the data’s fresh or stale. “2026-06-14 09:15 ET” sits at the top of every update. The headline follows in one line, summarizing index direction and percentage move in 8 to 12 words: “S&P 500 4,300.25, down 0.6% on CPI miss.” Index levels come next with exact decimals, showing SPX, NDX, or local equivalents alongside their percentage changes.
Top movers occupy the next 2 to 4 bullets, each listing ticker, price, percentage change, and catalyst. “AAPL 172.35, down 2.8%, earnings miss. TSLA 255.10, up 3.6%, guidance raise.” Support and resistance levels follow with at least two of each, tagged with intraday, daily, or weekly labels. “SPX R1 4,350 (intraday), S1 4,280 (daily).” Volatility and volume notes close the snapshot with quick stats like VIX change and volume multiples. “VIX 16.3, up 2.5 pts. SPX volume 1.2× average.”
The snapshot should be scannable in under 15 seconds. You look for the headline first, then drop to levels, then check top movers and catalysts. If the snapshot runs longer than 6 bullets, it’s no longer concise and should be split into an alert plus a follow-up note.
Standard snapshot components:
- Timestamp with timezone at the top: “2026-06-14 09:15 ET”
- Headline – One line with index name, price, and percentage change
- Index levels – SPX, NDX, RUT or equivalents with exact decimals and percentages
- Top movers – Ticker, price, percentage, catalyst in 1 line each (limit 3 to 5)
- Support/resistance – S1/S2 and R1/R2 with exact prices and timeframe labels
- Volatility and liquidity – VIX change, volume vs average, IV if relevant
Understanding Actionable Catalyst Notes in Market Commentary

Catalyst bullets list the event, timing, and expected impact in one line. A standard format reads “US CPI 08:30 ET 06/15, consensus +0.3% m/m” or “NVDA earnings 16:00 ET 05/24, street EPS $5.25.” The timestamp includes date and time so you know whether the catalyst’s imminent or still hours away. The magnitude or consensus number gives context for how much volatility to expect.
Earnings bullets follow the same structure: ticker, price reaction if post-release, and key takeaway. “TSLA 255.10, up 3.6%, guidance raise beats street by 15%.” Only the top 3 catalysts should appear in any single update to avoid overload. If more than 3 events matter, split them across separate alerts or tag lower-priority items as “watch” instead of “trade.”
How to filter catalysts by impact and time sensitivity:
- Rank by expected volatility. CPI, Fed decisions, and major earnings typically move indices more than minor data prints.
- List chronologically. Earliest event first so you can prep stops and entries in order.
- Include magnitude when known. Consensus estimates, beat/miss percentages, or prior print comparisons.
- Drop low-impact items. Skip regional economic data or minor sector news unless it directly affects a highlighted ticker.
Technical Levels and Trade Structure Essentials

Every commentary must include at least two support and two resistance levels with exact numbers and timeframe labels. You need to know whether S1 is a daily pivot or an intraday floor. Writing “support around 4,280” is too vague. The correct format reads “S1 4,280.00 (daily), S2 4,240.00 (weekly).” Resistance levels follow the same rule: “R1 4,330.00 (intraday), R2 4,360.00 (daily).”
Trade structure includes entry zone, stop, target, horizon, and confidence. A complete instruction reads “Entry 1.0760 to 1.0780, stop 1.0700, target 1.0900 within 2 sessions, 60% confidence.” The trigger must be explicit: “on 1-hour close above 1.0850” or “if price breaks below 4,300 on volume >2× average.” Confidence expressed as a percentage tells you how much conviction sits behind the idea.
Indicator highlights should reference exact thresholds. Instead of saying “RSI is high,” write “RSI(14) 72 on 1-hour chart, overbought.” ATR multiples help size targets: “Target = entry + 1.5× ATR(14)” or “Stop = entry minus 0.8× ATR.” Moving average levels get exact prices: “Price trading 12 points below 50-day MA at 4,312.00.” Specific numbers let you validate the setup on your own charts before entering.
Must-have elements in trade structure:
- Entry zone – Single price or range (e.g., 1.0760 to 1.0780)
- Stop level – Exact price or percentage (e.g., stop 1.0700 or stop at 1.2% loss)
- Target(s) – Primary and optional secondary targets with prices
- Trigger condition – Explicit event or price action that confirms entry (e.g., 1-hour close above 1.0850)
- Time horizon – Intraday, daily, swing, or specific session count (e.g., within 2 sessions)
- Confidence or probability – Percentage or qualitative (e.g., 60% or medium conviction)
How to Write Concise Market Commentary for Traders

Building concise commentary starts with a strict framework that keeps every update consistent and scannable. The framework runs in five steps: headline, key levels, catalyst with timing, trade instruction, and confidence. Each step has a purpose and a word budget. The headline sets direction and urgency in one line. Levels give you exact price zones to watch. The catalyst explains why the setup matters right now. The trade instruction provides entry, stop, target, and horizon. Confidence closes with a probability or trigger condition that tells you when the idea’s live and when it’s invalidated.
How to Build a One-Line Headline
The headline contains the instrument, current price or direction, and the primary action in 8 to 20 words. Start with the ticker or index name, state the action (buy, sell, watch, neutral), then add the trigger price or key level. An effective headline reads “Buy EUR/USD on break above 1.0850, target 1.0900” or “Sell S&P 500 if break below 4,300, target 4,180.” The headline should be readable in under 5 seconds and tell you what to do without opening the rest of the note.
Skip introductory phrases like “We’re watching” or “It appears that.” Jump straight to the action: “Short NVDA below 520” or “Watch AAPL resistance at 175.” If the setup has no trade yet, write “Neutral, SPX range 4,280 to 4,350 until break.” The headline sets the tone for the entire update, so clarity and directness matter more than style.
How to Format Levels, Catalysts, and Trades
Levels require exact numbers and timeframe tags. Write “S1 1.0720 (daily), R1 1.0850 (intraday)” instead of “support near 1.07.” Timestamps sit next to catalysts: “US CPI 08:30 ET 06/15, consensus +0.3% m/m” or “TSLA earnings 16:00 ET 05/24, street EPS $5.25.” Every catalyst bullet includes timing, magnitude, and expected market reaction when known.
Trade instructions follow a fill-in template: “Entry [price], stop [price], target [price], horizon [timeframe], risk [percentage].” A complete example reads “Entry 4,295, stop 4,320, target 4,240, intraday, risk 0.75% of account.” Trigger rules state the condition that activates the idea: “on 1-hour close above 1.0850” or “if volume exceeds 2× average on the break.” Confidence percentages appear at the end: “60% confidence” or “medium conviction, watch for confirmation.”
Formatting stays consistent across updates. Use the same labels (S1/S2, R1/R2) every time. Use the same timestamp format (“2026-06-14 09:15 ET”) at the top of every note. Use the same trade structure (entry, stop, target, horizon, risk) in the same order. Consistency lets you scan faster because you know where to find each piece of information.
How to Apply Templates for Speed
Templates cut writing time by 50 to 80 percent by pre-formatting the structure and leaving blanks for live data. A Quick Alert template reads “[Instrument] [current price], [action] on [trigger] at [price], target [price], stop [price].” Fill in the blanks and publish: “EUR/USD 1.0785, buy on 1.0850 break, target 1.0900, stop 1.0720.”
A Brief Note template runs three bullets: Current, Levels, Trade. Example: “Gold 1,980, neutral into US CPI. S1 1,965, R1 2,005. Watch 10:00 ET print, buy on hold above 2,005 (target 2,040, stop 1,960).” A Short Commentary template expands to seven bullets: Headline, Snapshot, Levels, Catalyst, Trade, Vol/Tech Note, Next Update. Auto-populate the snapshot with live index prices and volume data, then manually edit the trade and catalyst lines.
Building a library of reusable lines speeds up repetitive sections. Save phrases like “Watch breakout above $X on >2× avg vol” or “Price trading 1.2× ATR below VWAP” and drop them into the volatility or technical note section. Store level labels in a macro (“S1 price, R1 price“) and populate the prices each session. Templates don’t make the commentary robotic if the trade idea and catalyst bullets are written fresh each time.
Comparison Between Concise Market Commentary Styles
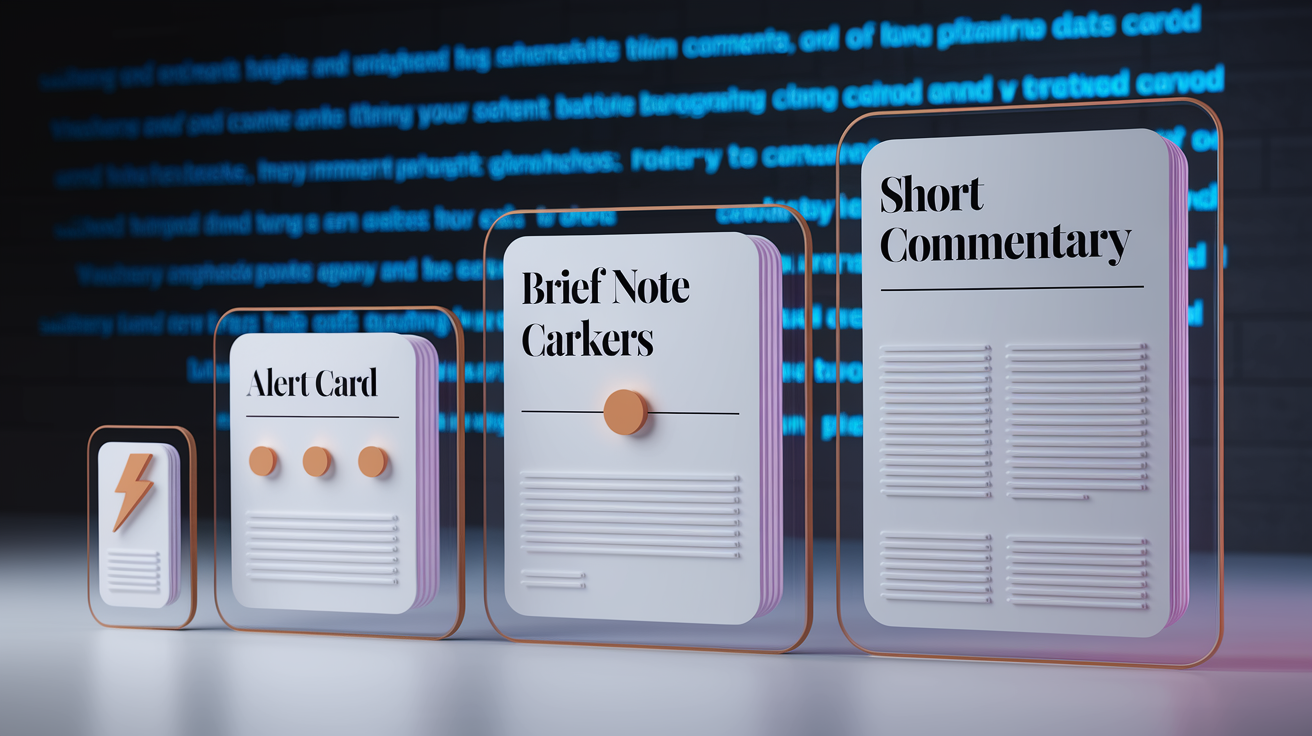
Different commentary styles serve different use cases and reading speeds. An alert is built for instant action. You get a ticker, a trigger, and a stop in one breath and decide whether to place the order. A brief note adds context by listing 2 to 3 levels and a catalyst so you understand why the setup matters. A short commentary expands further, offering 3 key levels, multiple scenarios, a volatility note, and next steps, giving you a complete picture in 45 seconds.
Effective examples use exact numbers and direct language. A clean alert reads “USD/JPY 153.40, sell into strength, R1 153.80, S1 152.60. Target 151.50, stop 154.20, 4-hour horizon.” Verbose examples bury the action under long paragraphs of macro background, historical comparisons, and overlapping scenarios without clear price triggers or stops: “The yen has been under pressure for weeks as the Bank of Japan maintains its accommodative stance while the Federal Reserve signals continued tightening, creating a divergence in policy that has driven flows into the dollar. Traders are watching whether resistance near 153.80 will hold, although some analysts suggest…” and so on.
| Format | Word Count | Use Case | Strength |
|---|---|---|---|
| Alert | 8 to 20 words | Intraday trigger or breaking news | Instant action, readable in <10 seconds |
| Brief Note | 30 to 60 words | Pre-market or session open snapshot | Adds levels and catalyst, 10 to 20 second read |
| Short Commentary | 75 to 150 words | Midday update or close wrap | Complete structure with trade, stop, target, and scenarios, 20 to 45 second read |
The difference between effective and verbose commentary isn’t just length but signal-to-noise ratio. Effective commentary delivers one clear thesis, two to four exact levels, one trade trigger, and one risk instruction. Verbose commentary layers on background, speculation, and multiple “what if” paths without committing to a single actionable plan. Traders skip verbose notes because they can’t extract a decision in under 30 seconds.
How to Benefit From Concise Market Commentary Techniques

Adopting concise commentary techniques in a trading workflow starts with a pre-publish checklist that enforces brevity and precision. The 3-second scan test checks whether the headline and first bullet convey the primary action without reading the rest. The read-aloud test checks whether the entire note can be spoken in 30 seconds or less. If it runs longer, trim or split. The accuracy check verifies that every price level and timestamp is exact and current.
Different distribution channels have different length targets. SMS alerts cap at 10 to 20 words because screen space is limited and readers are on mobile. Slack or chat updates run 20 to 40 words with a headline and 2 bullets. Email updates allow 75 to 150 words with a headline, snapshot, levels, trade, and catalyst. Publishing timing matters as much as length. Pre-market updates land 30 to 5 minutes before the open, open updates hit 30 minutes after the first print, midday notes publish between 11:30 and 13:30 local time, and close wraps go out within 15 minutes of the session end.
Template use and automation cut production time dramatically. Populate index prices, volume multiples, and percentage changes from a live data feed, leaving only the trade idea and catalyst for manual entry. Store reusable phrases in a macro library and insert them with keyboard shortcuts. Tag each update with a version number or update count so traders know if they’re reading the first or third revision of the day.
Workflow steps for concise commentary:
- 3-second scan test – Headline plus first bullet must convey the primary action
- Timestamping – Add date, time, and timezone at the top of every update (e.g., 2026-06-14 09:15 ET)
- Accuracy check – Verify all price levels, percentages, and catalyst times before publishing
- Template use – Pre-format structure and auto-populate live data to save 50 to 80% of writing time
- Distribution timing – Publish pre-market (T minus 30 to T minus 5), open +30 min, midday, and close wrap on a fixed schedule
Final Words
In the action, this piece gave a short playbook for trader-first notes: one-line headline, 2–4 bullets, exact levels, timestamps, and a clear trade trigger.
We ran through formats, pros and cons, snapshot components, catalyst filtering, and trade structure so you can write faster without losing precision.
Templates and the 5-step framework cut work time and help consistency. Mastering how to write concise market commentary for traders will speed your workflow and keep risk small. Start with the templates, run the 3-second scan, and trade with more confidence.
FAQ
Q: What is the 3 5 7 rule in trading?
A: The 3 5 7 rule in trading is an informal heuristic traders use to structure entries, confirmations, or targets; meanings vary (example: 3 confirmation bars, 5-period MA, 7-tick target). Always define it in your plan.
Q: Can ChatGPT write a trading algorithm?
A: ChatGPT can write a trading algorithm by producing strategy code, pseudocode, or backtest scripts, but it cannot access live market data or execute trades; always backtest, validate, and add risk controls before use.
Q: Is it true that 97% of day traders lose money?
A: The claim that 97% of day traders lose money comes from selective studies and samples; many retail day traders do fail, but exact rates vary—focus on edge, strict risk limits, and realistic expectations.
Q: Who owns 88% of the stock market in the USA?
A: The claim that 88% of the US stock market is owned refers to concentration among the wealthiest households and large institutions—roughly the top 10% of households plus pensions, funds, and corporate holders.