


What if the most important detail in earnings isn’t the numbers but the words managers use?
Press releases are polished; Q&A is where conviction shows.
This post shows a repeatable process to read tone, hedges, and alignment so you spot cracks before the market does.
You’ll learn to mark shifts between prepared remarks and live answers, track verb downgrades, and treat evasions as actionable risk.
It’s about building simple rules: log the language, set a clear invalidation, and size the trade so losses stay small.
Core Techniques for Interpreting Management Conference Call Commentary

Learning to interpret management conference call commentary is probably the most important skill you’ll develop if you want to pull real information out of quarterly earnings. Buy-side analysts don’t trade headlines. They’re reading 30 to 60 page transcripts and spending 30 or 40 minutes digging through Q&A and guidance sections because that’s where unscripted tone leaks and conviction cracks start to show. Press releases get vetted and polished. Transcripts capture what happens when the script ends and analysts start pressing.
Start by identifying shifts between prepared remarks and live Q&A. Prepared remarks are controlled. Management picks the metrics, highlights the wins, frames the narrative. Q&A is pressure. If the CFO says “disciplined” and “durable” in prepared remarks but switches to “broadly in line” or “subject to macro conditions” when analysts ask follow-ups, that’s a conviction drop. Watch for verb downgrades across quarters. “Expect” sliding to “anticipate” or “comfortable” weakening to “monitoring.” Hedging phrases like “visibility is limited” or “more measured customer behavior” are early warnings. The gap between CEO optimism and CFO caution matters. CEO talks vision. CFO owns the numbers. If those two don’t align, the CFO’s tone wins.
Turn this into a repeatable process. Log the language, compare it quarter over quarter, and quantify discrepancies between what was said and what the numbers actually show. Capturing tone, hedges, and specific wording isn’t about paranoia. It’s about building a data set that helps you see narrative drift before it shows up in the stock price.
Six core interpretation steps:
- Tone reading. Mark every hedge, every confidence word, every shift in adverb or verb strength between this call and the last one.
- Detecting hedges. Flag phrases like “largely,” “generally,” “broadly,” “subject to,” and “limited visibility.” Count how many appear. Compare to prior calls.
- Comparing verbs to prior calls. Did guidance language move from “we expect” to “we anticipate” or “we’re monitoring”? That’s weaker conviction even if the range stayed the same.
- Checking alignment between CEO and CFO. If the CEO is upbeat and the CFO is hedging on margins or cash flow, the CFO’s language is your signal.
- Extracting guidance ranges. Write down every explicit number: revenue range, EPS, buyback amount, capex, margin target. Note the verb that accompanies each range.
- Quantifying discrepancies. If prepared remarks say “strong demand” but Q&A dodges questions on inventory or customer timing, log that gap and treat it as a near-term risk.
Breaking Down Prepared Remarks to Extract Actionable Signals

Prepared remarks are where management frames the quarter. This is polished messaging. They choose the revenue story, highlight margin drivers, and present unit economics that support the thesis. You’re looking for specifics: revenue growth percentages, comparable store sales figures, sales per square foot, operating margin expansion, free cash flow generation. The more numbers, the stronger the signal. When management says “sales growth of 20%” or “comparable store sales growth of 13.4%,” those are concrete. When they say “solid performance” without a number, that’s soft. Confidence words like “durable,” “structural,” and “pricing power” suggest management believes the trend will hold. Phrases like “disciplined capital allocation” or “consistent unit economics” indicate control and repeatability. Those are green lights for modeling forward quarters.
One-time or nonrecurring explanations require immediate scrutiny. If management attributes a margin miss to “onetime integration costs” or “elevated promotional activity,” ask whether those costs are truly isolated or whether they’re becoming a pattern. Check prior transcripts. If the same “onetime” explanation appeared last quarter, it’s not onetime. It’s recurring, and margins are under pressure. Flag any commentary that shifts blame externally without accountability: “macro uncertainty,” “choppy demand,” or “customers optimizing spend” are all hedges. They’re real factors, but if they’re used to excuse underperformance without a clear mitigation plan, treat them as red flags.
| Driver Mentioned | What It Implies | How to Validate |
|---|---|---|
| Revenue trends (e.g., “20% growth, driven by new stores and comps”) | Confidence in both unit expansion and same-store strength; signals momentum. | Compare new store sales/week to company average; check if comp growth is accelerating or decelerating vs prior quarters. |
| Margin drivers (e.g., “operating leverage from fixed cost absorption”) | Suggests scale benefits are kicking in; margins should expand if revenue holds. | Check gross margin and operating margin trends; confirm no offsetting SG&A increases or promotional spend. |
| Capex commentary (e.g., “capex of $X million for store expansion and tech infrastructure”) | Quantifies growth investment; high capex with clear ROI is positive; vague capex is a warning. | Compare capex to revenue growth and free cash flow; ensure cash conversion isn’t deteriorating. |
| One-time adjustments (e.g., “excluding restructuring charges, adjusted EPS was…”) | Non-GAAP framing; may obscure recurring issues if adjustments repeat across quarters. | Read the reconciliation table; check if “onetime” items appeared last quarter; calculate GAAP results and model those instead. |
Reading Q&A Commentary to Detect Pressure, Evasion, and Clarity
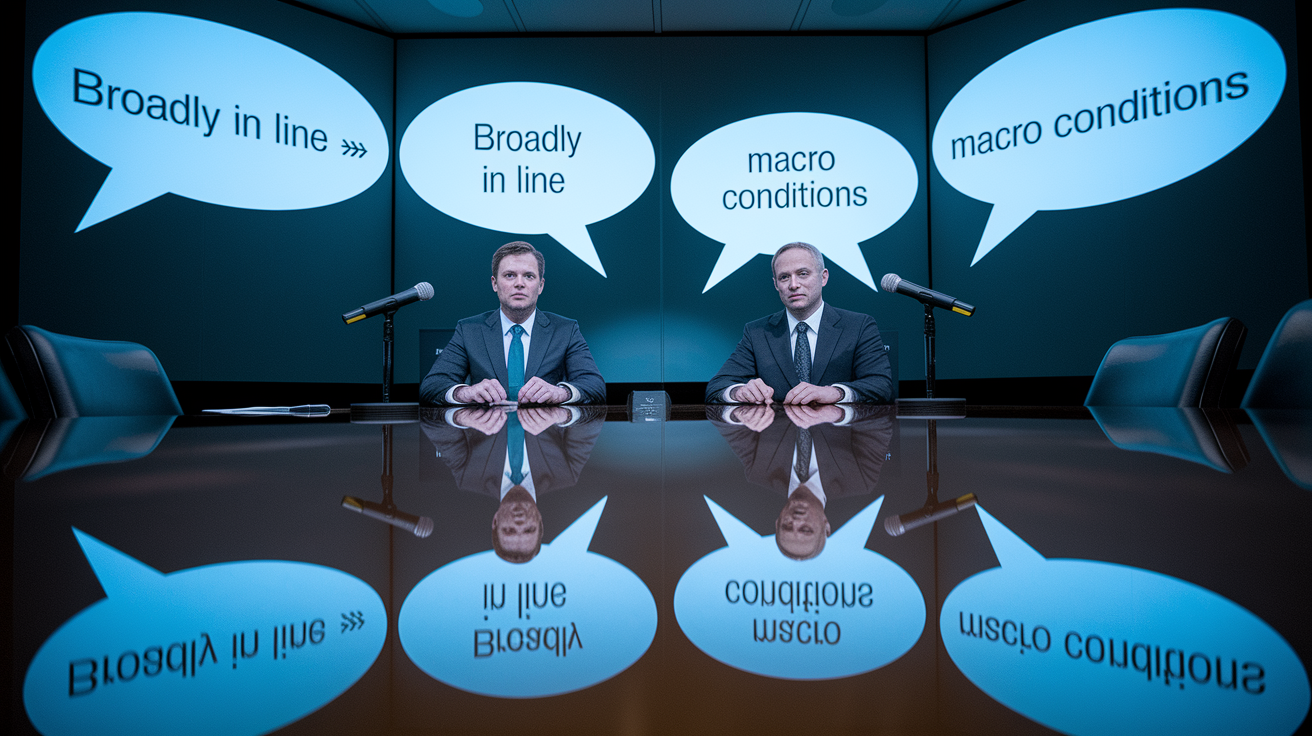
Q&A is where the script breaks. Analysts press on the topics that don’t add up, and management’s answers, or lack of answers, tell you what’s real. If multiple analysts ask versions of the same question, that’s unresolved market concern. When two different analysts ask about China inventory timing or demand visibility, and the CFO replies with “broadly in line” instead of a specific number, that’s a dodge. “Broadly in line” is hedge language. It means “we’re not comfortable giving you the clean answer, so we’re using soft phrasing to avoid commitment.” Apple Q2 2026 is a textbook example: analysts pressed twice on China iPhone timing, and the CFO leaned on “broadly in line” and “macro conditions.” Services got direct, quantified answers. China didn’t. That divergence signals near-term risk concentrated in the weaker area, even if the headline numbers looked clean.
Pressure dynamics matter. Watch which questions get direct answers and which ones get reframed. A direct answer quantifies the issue, defines what’s known versus unknown, and explains the tradeoff: “We see X happening, it impacts Y by Z, and here’s the mitigation plan.” An evasive answer shifts the topic, emphasizes long-term optimism without addressing the near-term gap, or repeats prepared remark language verbatim. Long winded answers that avoid the core question are red flags. So is repeated deflection across multiple analysts. If three analysts ask about pricing power and management never gives a specific retention rate or churn figure, assume the data isn’t supportive. Silence and deflection are data. When management refuses to quantify a key driver, model that driver as weaker until proven otherwise. Topic allocation is also a signal: if Q&A spends 60% of the time on one issue, margins, demand, a specific geography, that’s where the street sees risk, and you should too. For a detailed breakdown of how buy-side analysts prioritize Q&A signals, see How to Read an Earnings Call Transcript Like a Buy-Side Analyst.
Five indicators of Q&A credibility:
- Direct numeric responses. Management gives specific figures, timelines, or percentages in answer to analyst questions (e.g., “Services revenue grew 12%, driven by a 15% increase in subscriptions”).
- Consistent explanations. The story in Q&A matches prepared remarks; no new hedges or narrative shifts appear under pressure.
- Specific risk acknowledgment. Management names the problem directly, quantifies the potential impact, and outlines a mitigation plan with timing.
- Refusal to quantify. Management dodges requests for specific numbers (churn rate, unit growth, regional breakdown) and instead offers qualitative reassurance. Treat as a yellow or red flag.
- Long-winded reframing. Analyst asks about near-term margin pressure; management responds by pivoting to long-term strategy without addressing the question. This is deflection, not clarity.
Interpreting Forward Guidance, Ranges, and Probability Language

Forward guidance is where management puts numbers on the future, and the language they use tells you how confident they are in those numbers. Narrow ranges show conviction. Wide ranges show uncertainty. A guidance range of “15% to 17% revenue growth” is tighter and more confident than “10% to 20%.” Pay attention to the verb. “We expect” is stronger than “we anticipate,” which is stronger than “we hope” or “we’re monitoring.” Verb shifts across quarters are critical. If last quarter management said “we expect 15% to 17% growth” and this quarter they say “we anticipate growth in the mid-teens, subject to macro conditions,” conviction just dropped even though the range stayed similar. The addition of “subject to macro conditions” is a hedge, and the verb downgrade from “expect” to “anticipate” signals reduced confidence. Safe Harbor disclaimers are legal requirements. Every call includes language like “we do not undertake any obligation to update forward-looking statements.” But repeated reliance on Safe Harbor phrasing to avoid giving specific guidance is a warning. Management sometimes hides behind “macro uncertainty” or “limited visibility” to avoid committing to numbers. That’s a signal in itself.
Some guidance is intentionally vague because management genuinely doesn’t know, and some is vague because management wants flexibility to miss without accountability. Your job is to figure out which. Compare guidance to consensus. If the street expects 18% growth and management guides to “mid-teens,” that’s a reset. If guidance matches consensus but the language weakens, more hedges, softer verbs, model the low end of the range. When guidance is qualitative instead of quantitative, translate it into a numeric range yourself and assign lower confidence. For example, if the CFO says “we’re comfortable with current margin expectations” without giving a number, check what the street is modeling and assume management is signaling they won’t beat it. Confidence words like “disciplined,” “durable,” or “structural” attached to guidance are positive. They suggest management believes the trend is sustainable. Apple’s Q2 2026 example used “disciplined” for operating expenses and “durable” for Services growth, which aligned with their margin guide and signaled those areas were low risk.
Five probability language cues and their implied conviction levels:
- “We expect” or “We are confident.” High conviction; management believes the outcome is probable and is willing to commit publicly. Model at the midpoint or high end of the range.
- “We anticipate” or “We believe.” Moderate conviction; management sees the trend but acknowledges variables. Model conservatively within the range.
- “We are monitoring” or “We remain cautious.” Low conviction; uncertainty is elevated, and management is hedging. Model the low end of any stated range or below consensus.
- “Subject to macro conditions” or “If current trends continue.” Conditional guidance; the outcome depends on external factors management can’t control. Assign lower probability and widen your scenario range.
- “We do not provide guidance on…” Zero conviction or deliberate opacity. Treat as a red flag if the topic is material (e.g., margins, cash flow, a major product line). Model conservatively and increase monitoring.
Understanding Non-GAAP Metrics, Adjustments, and Hidden Risks
Non-GAAP metrics exist to smooth volatility, but they also create room for management to obscure weakness. Every time you see “adjusted EPS,” “pro forma results,” or “excluding onetime charges,” stop and reconcile to GAAP. Ask what’s being excluded and why. Common adjustments include stock-based compensation, amortization of intangibles, restructuring charges, acquisition-related costs, and foreign exchange impacts. Some of these are legitimate non-cash or truly nonrecurring items. Others are recurring expenses dressed up as adjustments. If “onetime” restructuring charges appear every quarter, they’re not onetime. They’re part of the cost structure, and adjusted earnings overstate profitability. If stock-based compensation is excluded but it’s a significant portion of total compensation, adjusted metrics understate the real cost of running the business.
Aggressive adjustments are a warning sign. When management emphasizes adjusted results without providing a clear reconciliation table, dig into the footnotes or the 10-Q. Calculate GAAP net income, GAAP operating margin, and GAAP cash flow yourself. If adjusted metrics look strong but GAAP metrics are deteriorating, that’s a red flag. Management is using non-GAAP framing to distract from fundamental weakness. Recurring versus one-time is the key test. If the same “onetime” item repeats across three consecutive quarters, it’s structural, not episodic, and margins are under real pressure. Non-GAAP adjustments also affect cash flow interpretation. Adjusted EBITDA might look healthy, but if free cash flow is declining because working capital is ballooning or capex is spiking, the business isn’t generating the cash the adjusted metrics suggest. Always check the cash flow statement alongside non-GAAP commentary. Cash conversion, free cash flow divided by net income, should be stable or improving. If it’s declining while management highlights adjusted earnings growth, model the business on cash, not earnings.
Detecting Red Flags and Confidence Signals in Management Language

High value warning words appear in prepared remarks and Q&A when management is hedging or trying to soften bad news. “Lumpy” is the single highest value caution word. It almost always precedes a revenue or margin miss within one to two quarters. When a CFO says “demand was a bit lumpy this quarter,” that means a large customer delayed or a product cycle slipped, and the impact is bigger than they want to admit. “Macro headwind” shifts blame externally and often signals management doesn’t have an internal fix. “Choppy” is another reset word. It means trends aren’t clean, visibility is low, and guidance is at risk. Hedging phrases like “broadly in line,” “subject to macro conditions,” “visibility is limited,” “largely,” “generally,” and “more measured customer behavior” are all early warnings. They dilute specificity and create room for disappointment. Repeated use of these phrases across multiple calls indicates the narrative is weakening, and you should tighten stops or reduce position size.
Positive confidence language includes “pricing power,” “durable,” “structural,” “disciplined,” and “consistent unit economics.” These words signal management believes the trend will hold and isn’t at risk from near-term volatility. “Pricing power” is especially strong. It means the company can raise prices without losing customers, which protects margins in any environment. “Durable” suggests the revenue stream is sticky and repeatable. “Structural” means the improvement isn’t cyclical; it’s embedded in the business model. When these words appear consistently across quarters and are backed by quantified metrics, margin expansion, retention rates, unit growth, model those drivers as low risk and prioritize them in your thesis. Mismatches between CEO and CFO are critical red flags. If the CEO is optimistic about long-term strategy but the CFO hedges on near-term margins, cash flow, or guidance, trust the CFO. The CFO owns the model, and if they’re cautious, the numbers don’t support the CEO’s vision yet.
Six common red flags:
- Repeated hedges across consecutive calls. Same cautious phrases appear quarter after quarter; narrative is weakening, and guidance is at risk.
- Blame-shifting without accountability. Management attributes misses to macro, competitive pressure, or customer behavior but offers no internal action plan or mitigation.
- Refusal to quantify key drivers. Analysts ask for specific numbers on churn, unit growth, or regional performance; management deflects or gives qualitative reassurance instead.
- Inconsistent answers across analysts. Different analysts get different versions of the same answer; signals internal uncertainty or deliberate opacity.
- Overuse of non-GAAP metrics without reconciliation. Adjusted results are emphasized, but GAAP numbers are buried or not discussed; often masks margin or cash flow deterioration.
- CFO visibly more cautious than CEO. CEO talks growth and vision; CFO hedges on margins, guidance, or cash conversion; the CFO’s tone is the actionable signal.
How to Convert Commentary Into Model Updates and Actionable Takeaways

Commentary becomes useful when you translate it into numbers and decisions. Start by logging every quantified statement: guidance ranges, buyback amounts, capex plans, unit economics, and margin targets. If the CFO says “we expect Services revenue to grow 12% to 14% next quarter,” write that down with the exact verb used. “Expect” has higher conviction than “anticipate.” Track quarter over quarter verb and hedge changes. If last quarter guidance used “expect” and this quarter uses “anticipate” with the same range, downgrade your model to the low end of that range because conviction dropped. Log every caution word and confidence word. Count how many hedges appeared this call versus last call. If hedges increased from two to six, that’s a trend, and it predicts softer results ahead even if this quarter’s numbers looked fine.
Tonality shifts matter for positioning and timing. If management’s tone weakened but the stock rallied on a headline beat, that’s a fade setup. Wait for the next session and watch for distribution. If tone strengthened and the stock sold off on a small miss, that’s a potential reload if the thesis is intact. Documenting tone and comparing it to prior quarters builds a data set that helps you spot inflection points early. Capture three takeaways after every call: one operational (a specific metric or guidance change), one narrative (how management is framing the story), and one risk (what could break the thesis in the next 90 days). This forces clarity and prevents you from getting lost in 60 pages of transcript. Track repeated analyst topics. If analysts pressed on margins for two consecutive quarters and management still won’t quantify the driver, that’s unresolved risk, and you should reduce exposure or tighten your invalidation level.
Four steps for updating a model after a call:
- Update guidance and ranges. Replace prior assumptions with the new explicit guidance; adjust revenue, EPS, margin, and cash flow projections to reflect management’s stated ranges and verb conviction.
- Reconcile non-GAAP to GAAP. Calculate GAAP net income, operating margin, and free cash flow; if adjusted metrics diverged significantly from GAAP, model the business on GAAP numbers and treat non-GAAP as management spin.
- Score tone and language shifts. Assign a simple score (1 to 5) for conviction based on hedge count, verb strength, and CEO/CFO alignment; if the score dropped vs last quarter, lower your probability weighting on upside scenarios.
- Flag follow-up items and set alerts. Note any dodged questions, repeated caution words, or discrepancies between prepared remarks and Q&A; set calendar reminders to check those items in the next quarterly filing or call.
Building a Repeatable Framework for Conference Call Interpretation

A structured ritual prevents you from missing signals and wasting time. Within 24 hours of the call, grab the transcript from a free source, Motley Fool, Stocktitan, or Seeking Alpha, and skim prepared remarks in five to ten minutes. Your goal in the skim is to extract headline metrics and spot any obvious language shifts. Then spend 30 to 40 minutes on Q&A and guidance. That’s where the real information lives. Focus on repeated questions, hedge phrases, and discrepancies between what management said in prepared remarks versus how they answered under pressure. Use a simple note template: date, ticker, key metrics (revenue, EPS, margins, guidance), signal words logged (caution and confidence), tone score (1 to 5), and three takeaways (operational, narrative, risk). This structure keeps you consistent and makes it easy to compare across quarters.
Track language consistency across consecutive calls. If “disciplined” appeared three times last quarter and once this quarter, that’s a signal. Management is backing off a prior strength area. If “subject to macro conditions” wasn’t used last quarter but appeared four times this call, conviction dropped and you should model more conservatively. CEO versus CFO alignment is part of your checklist every time. If their tones diverge, note it explicitly and prioritize the CFO’s language for modeling. Free transcript sources are sufficient for US large caps. You don’t need a paid terminal unless you’re covering small caps or international names. Motley Fool and Stocktitan post transcripts within one day. Seeking Alpha has an extensive archive but sometimes gates older content.
Prioritize calls that matter. Don’t read every transcript for every position. Focus on your largest positions and names where the investment thesis is actively changing. Two to three well read transcripts per quarter per important holding outperforms skimming dozens. Build the habit of logging and comparing. Quarter over quarter comparison is the skill that compounds. Once you have three to four quarters of logged signal words and tone scores, you’ll see inflection points forming before they show up in the numbers. Turn this into a 24 hour workflow: get the transcript, skim prepared remarks, dig into Q&A, log signals, compare to prior quarters, update your model, and set follow-up reminders for dodged questions or weak areas.
Seven checklist elements for systematic call analysis:
- Tone tracking. Log every hedge phrase and confidence word; count them; compare to the prior two calls to detect trend changes.
- Guidance extraction. Write down explicit numeric ranges, verb strength, and any new hedges or conditions; note whether ranges tightened or widened.
- Hedge detection. Flag every use of “broadly,” “largely,” “subject to,” “limited visibility,” “monitoring,” and similar phrases; increasing hedge count signals weakening conviction.
- Non-GAAP reconciliation. Identify every adjusted metric; reconcile to GAAP; check if “onetime” items are recurring; model on GAAP if adjustments are aggressive.
- Q&A discrepancies. Compare prepared remarks to Q&A answers; note topics where management’s tone shifted, answers were evasive, or questions were repeated across multiple analysts.
- CEO vs CFO alignment. Document whether CEO optimism is matched by CFO specificity; if not, prioritize CFO language for modeling and risk assessment.
- Follow-up items. List any dodged questions, missing quantifications, or unresolved concerns raised by analysts; set calendar alerts to revisit these in the next 10-Q or call.
Final Words
On a live call, this is the work: read prepared remarks for headline metrics and one-timers, then dig into Q&A for pressure, hedges, and evasions. Watch verb shifts, compare CEO vs CFO, and flag non-GAAP adjustments.
Turn those signals into model edits: update guidance ranges, quantify conviction changes, and list follow-ups. Build the 24-hour checklist and log signal words so you can repeat the process. Use this map to stay disciplined and sharpen how to interpret management conference call commentary. You’ll make cleaner decisions and see fewer surprises.
FAQ
Q: How to write management discussion and analysis?
A: To write management discussion and analysis, explain results, drivers, and risks clearly; compare to prior periods, reconcile non‑GAAP items to GAAP, state forward guidance and assumptions, and highlight key metrics for investor decision-making.
Q: What is a 3-way conference call?
A: A 3-way conference call is a phone bridge connecting three participants—commonly an investor, a company rep, and an advisor—used for direct Q&A, deal talks, or coordinating information between parties in real time.
Q: What is the purpose of management commentary?
A: The purpose of management commentary is to explain financial results and business drivers, provide context and forward guidance, surface risks and assumptions, and help investors and analysts assess company performance and near-term outlook.
Q: What is the best etiquette for conference calls?
A: The best etiquette for conference calls is to join on time, mute when not speaking, identify yourself before commenting, keep points concise, share an agenda and materials in advance, and use clear audio with polite turn-taking.