

What if a single factory outage can reset an entire industry’s playing field?
Supply chain disruptions aren’t all the same. Some are noise. Some force lasting change.
This post gives a clean framework to tell the difference: the thesis is that duration, chokepoint concentration, cost shock, policy response, and competitive swings decide whether an event becomes a sector catalyst.
Read on for clear levels to watch, simple scenarios to run, and the exact tests I use to decide when to reposition risk.
Framework for Evaluating Supply Chain Disruptions as Catalysts
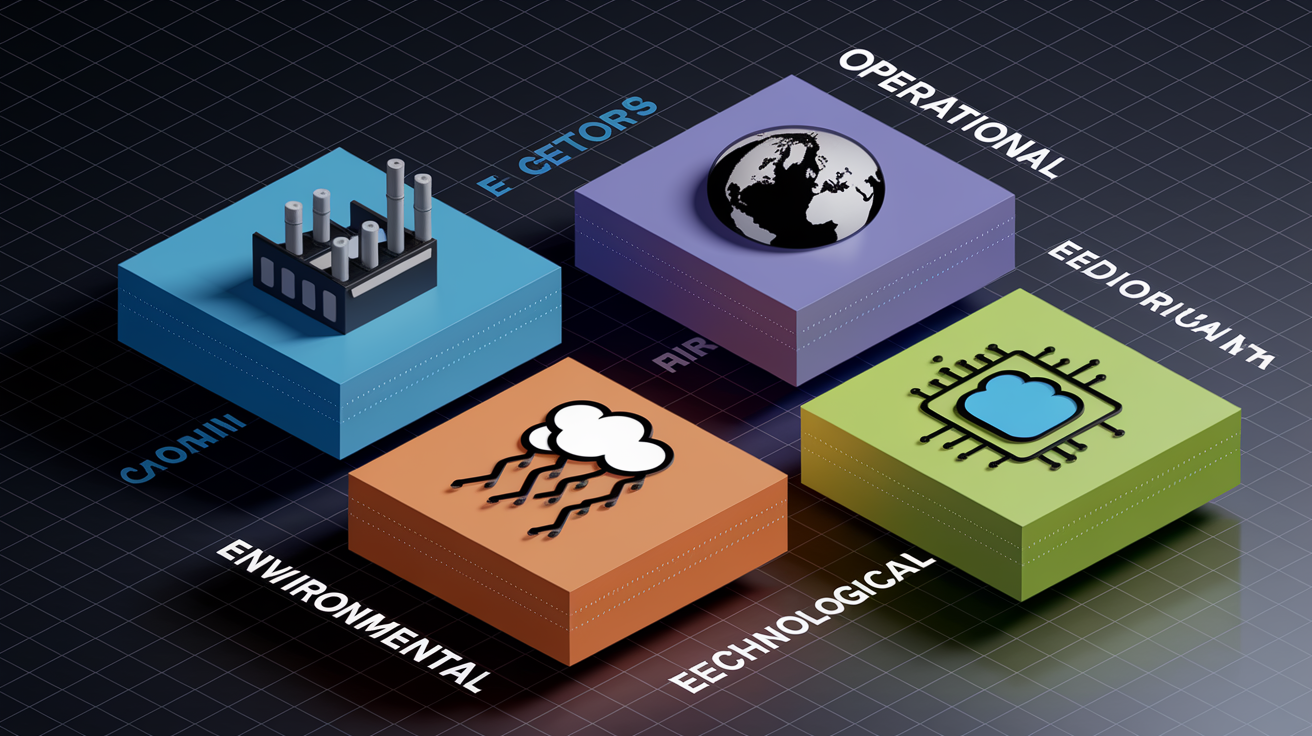
Supply chain disruptions break down into four categories that decide whether they’ll reshape entire sectors. Operational disruptions cover factory shutdowns, quality failures, and transport breakdowns that stop or slow goods movement. Geopolitical disruptions include tariffs, sanctions, trade wars, and border closures that rewrite the rules for cross-border commerce. Environmental disruptions span natural disasters, climate events, and resource scarcity that wipe out or degrade critical inputs. Technological disruptions involve cyber incidents, system failures, and rapid shifts in production methods that make legacy processes obsolete or insecure.
Each category triggers sector impact differently. Cost shocks happen when disruptions force companies to pay more for inputs, freight, or compliance, squeezing margins across whole industries. Demand shifts occur when scarcity or delays push customers toward substitutes or different suppliers, redistributing market share. Regulatory changes speed up when governments respond to visible failures with new mandates around sourcing, safety, or resilience, raising the cost of doing business. Technology adoption surges when disruptions expose how fragile manual or analog systems really are, prompting quick investment in automation, visibility platforms, or digital twins.
Not every disruption becomes a catalyst. Temporary shocks fade without lasting structural change. Catalytic disruptions permanently alter how sectors operate, compete, or allocate capital.
Criteria for determining when a disruption becomes a sector catalyst:
- Duration exceeds typical recovery windows. Events lasting beyond 90 days force companies to redesign networks rather than wait for things to normalize.
- Concentration of critical nodes. When disruption hits a chokepoint (single supplier, port, or component) that serves multiple downstream industries, ripple effects multiply fast.
- Magnitude of cost or capacity shock. Input cost increases above 15–20% or capacity reductions beyond 10% for extended periods force permanent sourcing or product changes.
- Regulatory or policy response. Government intervention through subsidies, tariffs, or new compliance rules locks in structural shifts and redirects capital.
- Competitive repositioning. Market share swings of 5+ percentage points among top competitors within 12–24 months signal that the disruption has reordered industry dynamics.
Methodologies for Assessing Cross‑Sector Impact

Structured assessment starts with mapping the supply network as a directed graph where nodes represent suppliers, factories, ports, and distribution points. Edges capture lead times, capacities, and costs. Analysts compute criticality scores for each node using betweenness centrality (how many paths flow through it) and supply elasticity (how easily capacity can substitute). This topology reveals which disruptions spread widely versus stay localized.
Scenario analysis layers probability distributions over disruption duration, severity, and geographic scope. Teams run Monte Carlo simulations with thousands of iterations to estimate revenue at risk, margin compression, and recovery time under mild, moderate, and severe cases. The output is a distribution of outcomes rather than a single forecast, showing both the expected impact and tail risks. Decision makers set thresholds. For example, if a 10th percentile outcome threatens more than 15% of quarterly revenue, the disruption warrants strategic response.
Risk matrices combine likelihood and impact into a two-dimensional grid, but catalytic assessment adds a third axis: persistence. A high impact, low likelihood event that resolves in days is an operational issue. The same event lasting quarters becomes a catalyst if it shifts cost structures or forces capacity reallocation. Cross-industry mapping identifies common dependencies. When multiple sectors rely on the same semiconductor foundry, shipping lane, or raw material source, you’re looking at amplified probability of contagion and higher urgency around diversification. Practical frameworks score each potential disruption on magnitude × duration × centrality × contagion, prioritizing the top 10–20% for deep scenario investment and board level review.
Historical Case Studies of Sector‑Level Catalysts

The 2020–2022 global semiconductor shortage demonstrated how a concentrated upstream bottleneck can catalyze long term shifts. Automakers relying on just in time chip deliveries faced production halts when foundry capacity couldn’t keep pace with pandemic era demand spikes for consumer electronics. Industry estimates put lost light vehicle production above 9 million units globally in 2021 alone, with Q3 2021 accounting for roughly 3.5 million lost units. The shortage forced manufacturers to redesign vehicle platforms to use fewer or more readily available chips, accelerated plans to invest in regional semiconductor fabs, and triggered government subsidies for domestic chip production. The result was a permanent increase in automaker engagement with chip suppliers, vertical integration attempts, and a multi-billion-dollar buildout of new foundry capacity across the U.S., Europe, and Asia.
The 2021 container shipping bottleneck reshaped logistics economics and sourcing strategies. Port congestion and equipment shortages pushed spot container rates from China to the U.S. to over 1,000% of 2019 levels during peak periods. Dwell times at major U.S. ports spiked, and clearing backlogs required an estimated five days of normal operations for every day of disruption. Retailers and manufacturers responded by locking in long term freight contracts at elevated rates, shifting from ocean to air for critical SKUs despite cost premiums, and accelerating nearshoring projects to Mexico and Central America to reduce ocean dependency. Mexico overtook China as the largest U.S. trade partner, a structural shift driven by the calculus that shorter transit times and modal optionality justified modest landed cost increases.
The March 23–29, 2021 blockage of the Suez Canal by the container ship Ever Given illustrated how a brief chokepoint failure can expose systemic fragility. For six days, roughly 400 ships were delayed, and an estimated $9.6 billion per day in global trade value was affected. While the physical blockage cleared within a week, the incident accelerated investment in route diversification, alternative canal capacity discussions, and digital visibility platforms that could reroute shipments in near real time. Insurers raised premiums for single route dependencies, and companies with just in time models scrambled to add buffer inventory for critical components sourced via the canal.
| Event | Sector Affected | Resulting Catalyst Mechanism |
|---|---|---|
| 2020–2022 Semiconductor Shortage | Automotive, Consumer Electronics | Vertical integration, government subsidies for regional fabs, platform redesign |
| 2021 Container Shipping Bottleneck | Retail, Manufacturing, Logistics | Nearshoring acceleration, long-term freight contracts, modal diversification |
| March 23–29, 2021 Suez Canal Blockage | Global Trade, Heavy Equipment, Chemicals | Route diversification, buffer inventory increases, digital visibility investment |
Metrics and Indicators for Measuring Catalytic Potential
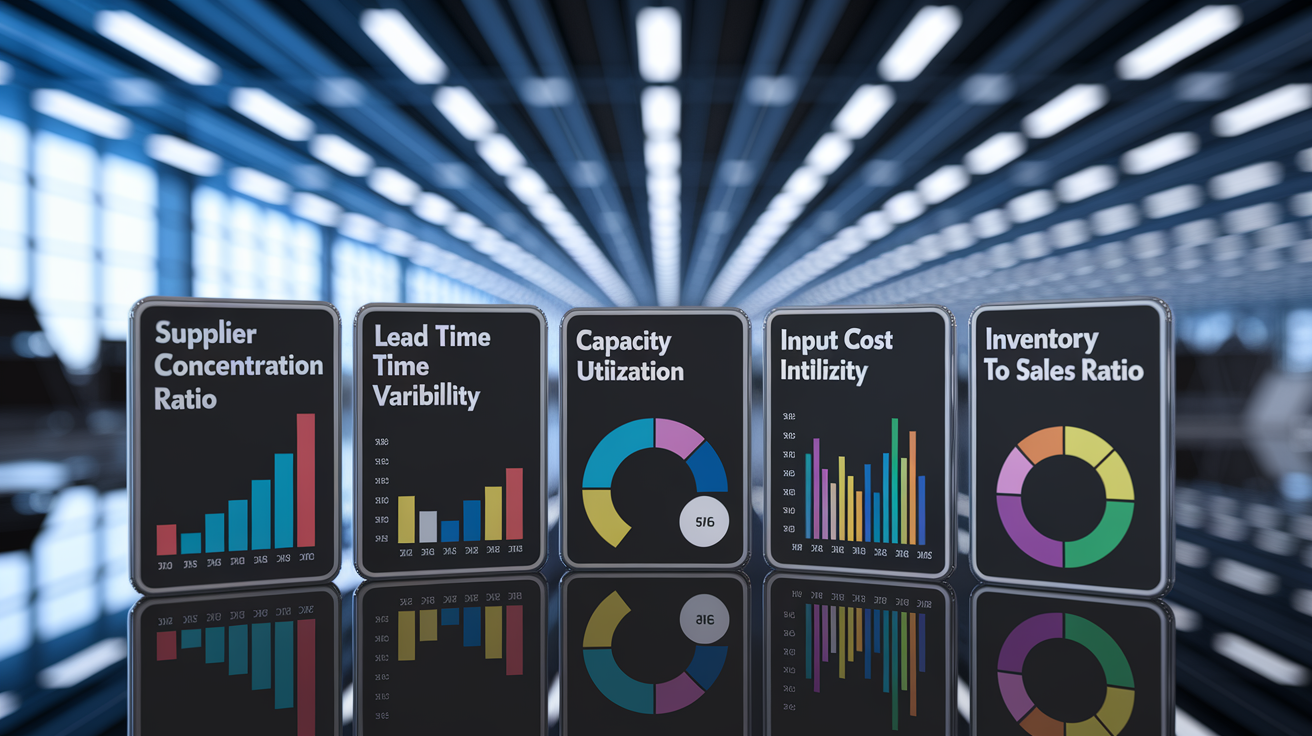
Five core metrics help identify whether a disruption will drive structural sector change.
Supplier Concentration Ratio gets calculated as spend with the top three suppliers divided by total category spend. Flag any category above 60% as high risk for catalytic failure if one of those suppliers experiences prolonged outage or exits.
Lead Time Variability tracks standard deviation of supplier delivery times measured in days. Persistent increases beyond historical baselines (for example, variability rising from ±3 days to ±15 days over consecutive quarters) signal network stress that forces companies to hold more safety stock or seek alternate sources.
Capacity Utilization Swings require tracking quarter over quarter changes in production capacity utilization across key supplier nodes. Swings exceeding 20 percentage points (from 75% to 95% or down to 55%) indicate either demand surges that strain supply or demand collapses that threaten supplier viability and trigger industry consolidation.
Input Cost Volatility measures the coefficient of variation (standard deviation divided by mean) for critical raw materials, components, or freight rates. When volatility doubles or triples relative to a rolling 12 month average, margin compression becomes persistent and companies are forced into long term hedging, redesign, or pricing actions that reshape competitive positions.
Inventory to Sales Ratio Changes compare days of inventory cover (inventory dollars divided by cost of goods sold per day) for critical SKUs. If the ratio rises from 30 days to 60+ days sector wide over two to three quarters, it signals companies are building buffers against perceived chronic disruption, locking in higher carrying costs and changing the economics of just in time models.
Monitoring these five indicators together reveals whether a disruption is an isolated event or the start of a structural shift. When three or more metrics breach their thresholds simultaneously and persist beyond a single quarter, the probability of catalytic sector change increases sharply.
Sector‑Specific Sensitivities and Vulnerability Mapping

Manufacturing sectors built on just in time principles show acute sensitivity to even short disruptions because they operate with minimal buffer inventory. Automotive assembly lines, for instance, can halt within days if a single critical component fails to arrive, and clearing the backlog requires weeks of overtime shifts and expedited freight. A three day port strike can trigger production losses that take 15 days to recover, amplifying the initial shock. These sectors prioritize lead time reliability over cost, making them early movers toward dual sourcing and nearshoring when disruptions become frequent.
Energy dependent industries face different vulnerabilities tied to commodity price shocks and fuel availability. Chemical manufacturers, primary metals producers, and heavy transportation operators experience margin compression when natural gas, crude oil, or electricity prices spike due to geopolitical events or infrastructure failures. Unlike discrete part shortages that can sometimes be worked around, energy disruptions hit variable costs directly and uniformly across competitors, forcing either price increases (which shift demand) or margin erosion (which triggers capacity exits). These sectors use long term energy contracts and vertical integration into power generation as primary hedges.
Retail and logistics sectors exhibit high exposure to freight cycles and consumer demand volatility. A prolonged container shortage or trucking capacity crunch raises distribution costs faster than retailers can adjust shelf prices, compressing margins and accelerating shifts toward regionalized distribution networks and private fleet investment. Seasonal businesses face compounded risk. A four week shipping delay during peak season can obsolete inventory and force end of season markdowns, converting a temporary logistics issue into a permanent revenue loss. Retailers respond by increasing safety stock for high velocity SKUs and diversifying carrier relationships, even at the cost of volume discounts.
Competitive Dynamics Triggered by Disruptions

Disruptions create winners and losers by reshaping the cost and speed advantages that underpin competitive positioning. Companies with diversified supplier bases and regional manufacturing footprints navigate disruptions with minimal production loss, gaining market share from competitors stuck waiting for single source deliveries or offshore shipments. During the 2021 chip shortage, automakers with deeper foundry relationships and flexible platform designs maintained higher production rates, capturing incremental sales and dealer inventory share. The competitive gap widened further when winners used the crisis to lock in long term supply agreements, effectively foreclosing access for smaller or slower moving rivals.
Strategic responses to disruptions often involve vertical integration, reshoring, and technology upgrades that raise barriers to entry and concentrate market power. Firms that invest in automation, predictive analytics, and digital twins during a disruption reduce their exposure to future labor shortages and manual process failures, creating a productivity moat. Reshoring critical production steps shortens lead times and insulates companies from tariff volatility, but the capital intensity and regulatory complexity favor large, well capitalized players. Over time, sectors that experience repeated disruptions see consolidation as smaller firms lacking the resources for resilience investments exit or merge, leaving a more concentrated competitive landscape with higher structural costs but lower operational fragility.
Investment and Strategic Planning Implications

Disruptions force long term capital reallocation toward resilience infrastructure, regional capacity, and technology platforms that reduce dependency on fragile nodes. Investors tracking capital expenditure announcements see sector leaders committing billions to nearshore manufacturing, domestic semiconductor fabs, and warehouse automation in response to multi-quarter supply shocks. These investments carry long payback periods (often six to eight years) but deliver strategic optionality and reduce future revenue at risk, justifying higher valuations for firms that move early. Portfolio managers incorporate disruption resilience as a screening criterion, favoring companies with low supplier concentration ratios, high inventory flexibility, and demonstrated ability to shift production geographically within quarters rather than years.
Sector rotation accelerates when disruptions reveal structural cost advantages in previously overlooked geographies or business models. The shift from offshore to nearshore manufacturing benefits logistics providers, contract manufacturers, and regional distribution platforms in Mexico, Central America, and the U.S. Southeast. Cybersecurity and supply chain visibility software vendors see sustained demand growth as companies race to deploy real time tracking, predictive analytics, and supplier financial monitoring. Conversely, pure play offshore exporters and commodity input heavy manufacturers with low pricing power face margin compression and valuation downgrades when input costs spike and customer tolerance for price increases proves limited.
Key strategic planning actions triggered by catalytic disruptions:
Scenario based stress testing. Run multi year revenue and margin projections under persistent cost shocks, lead time extensions, and capacity constraints to size required capital buffers and identify threshold triggers for supply chain redesign.
Supplier financial health monitoring. Embed procurement teams at critical suppliers to track working capital, debt covenants, and operational metrics, reducing the lag between supplier distress and internal response.
Regional capacity hedging. Secure contract manufacturing or warehousing capacity in at least two geographies, even if utilization remains below 50% in normal times, to create surge options during peak disruption periods.
Technology stack integration. Connect ERP, TMS, WMS, and supplier portals into a single real time visibility platform that reduces data latency from weeks to hours, enabling faster decision cycles and proactive rerouting before disruptions cascade.
Final Words
in the action we laid out a practical framework covering disruption categories, mechanisms of sector impact, and clear criteria to tell catalytic shifts from temporary shocks.
Then we ran methods and case studies, including semiconductors and shipping bottlenecks, and pointed to the metrics and vulnerability maps traders need.
Keep this toolbox handy when assessing supply chain disruptions as sector catalysts: mark the critical metrics, run scenarios, map vulnerabilities, and set clear invalidation levels. Stay disciplined – a planned process beats guessing, and there’s upside if you’re ready.
FAQ
Q: What categories of supply chain disruptions can act as sector catalysts?
A: The categories of supply chain disruptions that can act as catalysts are operational, geopolitical, environmental, and technological, each triggering cost shocks, demand shifts, regulatory change, or forced technology adoption.
Q: How do I tell if a disruption is catalytic or temporary?
A: The best way to tell is by checking persistence, regulatory response, capital reallocation, supplier exits, and durable behavior change; if several hold, the disruption looks catalytic rather than temporary.
Q: What practical methods assess cross‑sector impact from a disruption?
A: The practical methods are scenario analysis, risk matrices, structured assessment tools, supplier and input mapping, and stress tests to show how shocks propagate across industries and balance sheets.
Q: Which historical cases show disruptions became sector catalysts?
A: The key historical cases include the 2020 semiconductor shortage (chip reliance revealed), 2021 shipping bottlenecks (logistics rethinking), and past resource constraints that forced rapid innovation and reshoring.
Q: What metrics best indicate a disruption’s catalytic potential?
A: The most telling metrics are lead‑time variability, capacity utilization swings, input cost volatility, supplier concentration levels, and inventory‑to‑sales ratios as early warnings of structural change.
Q: How do different industries vary in sensitivity to disruptions?
A: The way industries vary is clear: manufacturing tied to just‑in‑time is highly sensitive, energy‑dependent sectors suffer price shocks, and retail/logistics feel freight cycle and demand rhythm disruptions hardest.
Q: How do disruptions reshape competitive dynamics?
A: Disruptions reshape dynamics by accelerating reshoring, vertical integration, supplier diversification, and technology upgrades, shifting market share toward firms that secure reliable supply or lower exposure.
Q: What should investors and corporate planners do after a catalytic disruption?
A: The smart moves are reassess capital allocation, run scenario‑driven portfolio stress tests, favor resilient supply chains and technology upgrades, and size positions to reflect changed risk‑return profiles.