


Think every earnings gap is a free-money trade? That’s the quickest way to get chopped.
A gap only shows overnight repricing; the first 30 to 60 minutes tell you if real buyers or sellers are in control.
This post breaks down simple candlestick setups you can use after an earnings gap, plus precise entry triggers and stop locations.
Most important: learn how volume confirms the candle and when the idea is invalidated.
You’ll leave with clear, repeatable rules for timing entries and sizing risk.
Best Candlestick Patterns for Trading Earnings Gaps

Earnings gaps create instant price dislocations. You can’t just jump in and hope for the best. The overnight gap alone won’t tell you if momentum carries through at the open. Only the first few candles after the bell show you what’s really happening.
Chart patterns don’t work the same way in the first 30 to 90 minutes after an earnings gap. Volatility spikes and collapses without warning. Candlestick setups filter the noise. They show you absorption, rejection, or continuation as it happens. A bullish engulfing candle after a gap-up? Buyers are committed. A shooting star at the opening range high? The gap’s running out of steam.
You’ll see the same candlestick formations around earnings events because they reflect how large funds actually trade. They don’t pile in all at once. They test levels, absorb selling, and confirm direction with volume. Candlesticks capture that behavior right on your chart.
The patterns below work when you pair them with gap context and volume confirmation. Use these as your visual signals for timing entries and stops after earnings releases.
Bullish engulfing after gap-up: Enter when price breaks above the engulfing candle high. Stop below the engulfing low. This pattern signals real continuation when it forms within the first hour and closes near its high.
Bearish engulfing after gap-down: Same idea, opposite direction. Entry below the engulfing low, stop above the high. Works best at resistance or after a bounce fails.
Hammer at gap-fill zone: Go long on a close above the hammer high. Stop below the hammer low. This pattern works when price dips into the gap and buyers step in with volume.
Shooting star near opening-range high: Short when price breaks below the shooting star low. Stop above the wick. Strong signal after a sharp gap-up when volume starts fading.
Doji or spinning top after gap: Wait for the next candle to confirm. A doji means indecision. Don’t trade it alone. Enter only after a clear breakout candle follows with volume.
Inside bar after volatile gap: Enter on a break of the inside bar high or low. Stop on the opposite side. Inside bars compress volatility and often lead to explosive moves, especially 2 to 5 days after earnings.
Morning star at gap support: Three-candle reversal. Gap-down, small-bodied indecision candle, then bullish confirmation. Enter above the third candle. Stop below the low of the sequence.
Evening star at gap resistance: Bearish version of the morning star. Gap-up, indecision, bearish confirmation. Enter below the third candle. Stop above the high of the pattern.
How to Interpret Earnings Gap Context Before Applying Setups

Gap direction matters more than gap size. A 5% gap-up on strong earnings and raised guidance is different from a 5% gap-up on a short squeeze with no real catalyst. Before you look at any candlestick, confirm the gap is driven by actual repricing. Revenue beats, guidance changes, sector rotation. Not just premarket noise or low-float manipulation.
Gap size relative to recent volatility tells you how much conviction institutions have. If a stock normally moves 1 to 2% per day and suddenly gaps 8%, that’s a breakaway signal. But if it gaps 1.5% on earnings when it already moved 2% yesterday, that’s a common gap. Likely to fill. Use ATR(14) on the daily chart as your baseline. A gap larger than 1.5× ATR usually needs institutional follow-through to hold. Anything smaller often gets absorbed within the session.
Premarket volume is your third filter. A gap-up on 10× normal premarket volume shows real demand before the open. A gap-up on thin premarket volume means algos repriced overnight, but buyers haven’t shown up yet. Scan for premarket volume at least 2.5× the usual premarket average before trusting any bullish candlestick setup. If volume’s light, wait for opening-range confirmation or skip the trade. Gaps without volume support reverse fast, and your candlestick entry becomes a trap.
Confirming Candlestick Setups With Volume After Earnings

Volume spikes validate candlestick signals. Without them, you’re trading chart shapes with no institutional backing. After an earnings gap, the first 30 to 60 minutes should show above-average volume if the move is real. Compare current volume to the 20-day average volume for the same time window. If a bullish engulfing candle forms at 9:45 a.m. but volume’s only 80% of normal, that’s a red flag. Real continuation setups print 1.5 to 2× average volume on the confirmation candle.
Low-volume continuation candles after a gap-up often come before sharp reversals. Early buyers are the only participants. When volume dries up within the first hour, it signals hesitation. Institutions are watching, not buying. If your candlestick setup triggers on weak volume, tighten your stop or cut size in half. These trades fail at the first resistance test.
The cleanest earnings gap plays combine a strong candlestick pattern with a volume surge on the confirmation bar. A hammer forming at the gap-fill zone means nothing if it closes on average volume. But if that same hammer prints 2.5× volume and closes in the top third of its range, it’s a high-probability long setup. Volume tells you whether the candlestick represents real absorption or just a temporary pause before the next leg down.
Entry and Exit Strategies for Post‑Earnings Candlestick Trades

Your entry should always wait for the candlestick pattern to complete and confirm with a directional break. Never enter mid-candle. If you’re trading a bullish engulfing setup, the pattern isn’t valid until the candle closes above the prior candle’s high and body. Then your entry trigger is a break above the high of that engulfing candle. Use a limit order one tick above the high to avoid chasing. If momentum’s real, you’ll get filled.
Wick-based invalidation keeps your stops logical and tight. On a hammer, the invalidation point is below the low of the hammer wick. On a shooting star, it’s above the high of the upper wick. These are the natural structure points where the pattern thesis breaks down. Place your stop one tick beyond the invalidation level. Not at arbitrary percentages. The market doesn’t care about round numbers. It respects the levels where buyers or sellers proved control.
Gap-zone retests offer high-probability re-entries when the initial move stalls. After a gap-up, if price pulls back into the top half of the gap and forms a bullish candle with volume, that’s often a better entry than chasing the open. The gap zone acts as support because institutions who missed the initial move use pullbacks to build positions. Mark the gap high and gap low on your chart as soon as the session opens. These become your retest reference zones.
Here’s a step-by-step entry method after an earnings gap:
- Wait for the first 15 to 30 minutes to pass and identify the opening-range high and low.
- Watch for a candlestick pattern to complete. Bullish engulfing, hammer, or inside-bar breakout.
- Confirm the pattern candle closes with volume at least 1.5× the recent average for that time window.
- Enter on a break of the pattern high (for longs) or low (for shorts) using a limit order one tick beyond.
- Place your stop below the pattern’s invalidation level. Wick low for longs, wick high for shorts. Scale out at 1R, then trail the remainder.
Timeframe Selection for Trading Earnings Gap Candlestick Patterns

The 5-minute chart is your primary execution timeframe for trading earnings gap candlestick setups intraday. This interval captures enough detail to see volume shifts and candlestick formations without the noise of 1-minute bars. Most reliable patterns (engulfing candles, hammers, shooting stars) need at least 5 minutes to develop clear wicks and bodies that represent real price action. Not just orderbook flicker.
For confirmation and context, add the 15-minute chart as your secondary view. A bullish engulfing on the 5-minute is stronger when the 15-minute candle is also bullish and trending in the same direction. If the 5-minute shows a hammer but the 15-minute is printing a large bearish candle, you’re fighting the bigger flow. Use the 15-minute to validate that your 5-minute setup aligns with the broader intraday trend.
Swing traders should rely on the 60-minute and daily charts to avoid getting chopped in the opening volatility. An inside-day setup on the daily chart after an earnings gap often resolves within 2 to 5 sessions and offers cleaner risk/reward than trying to scalp the first hour. If you’re holding overnight, the daily candlestick pattern and its relationship to the 20-day and 50-day EMAs matter more than any intraday noise. Let day traders fight over the first 30 minutes. You’re waiting for the daily candle to close and confirm the trend.
Risk Management Techniques for Earnings Gap Plays

Earnings gaps require wider stops than normal setups because volatility spikes in the first hour. If your usual stop is 1% on a standard breakout, expect to use 1.5 to 2.5% on an earnings gap play depending on the stock’s ATR. A stock that normally swings 2% per day might move 5% in the first 30 minutes after earnings. Your stop needs room to breathe, or you’ll get shaken out before the real move starts.
Position sizing must shrink when stop distance increases. If your risk per trade is fixed at 1% of your account and the stop is now twice as wide, your share size drops by half. Non-negotiable. Don’t convince yourself to risk 2% just because “the setup looks strong.” The math protects you when the gap reverses harder than expected. Happens often enough to matter.
Common stop placements for earnings gap candlestick setups include the low of the pattern (for longs), the high of the pattern (for shorts), or the midpoint of the gap if you’re trading a gap-fill scenario. For example, if a stock gaps from $50 to $55 and you’re shorting a shooting star at $54.50, your stop sits above $55 (the gap high). If it breaks back above that level, the gap-and-go thesis is intact and your fade idea is wrong. Midpoint stops around $52.50 work for trades that assume the gap will partially fill but not fully reverse.
Volume-shelf breakdowns offer another stop reference. After a gap-up, if price consolidates on heavy volume and then breaks below that consolidation with a spike in selling volume, the setup has failed. Place your stop just below the consolidation low and exit immediately if that level breaks. Waiting longer only increases your loss when the gap begins to fill.
Real Chart Examples of Earnings Gap Candlestick Setups
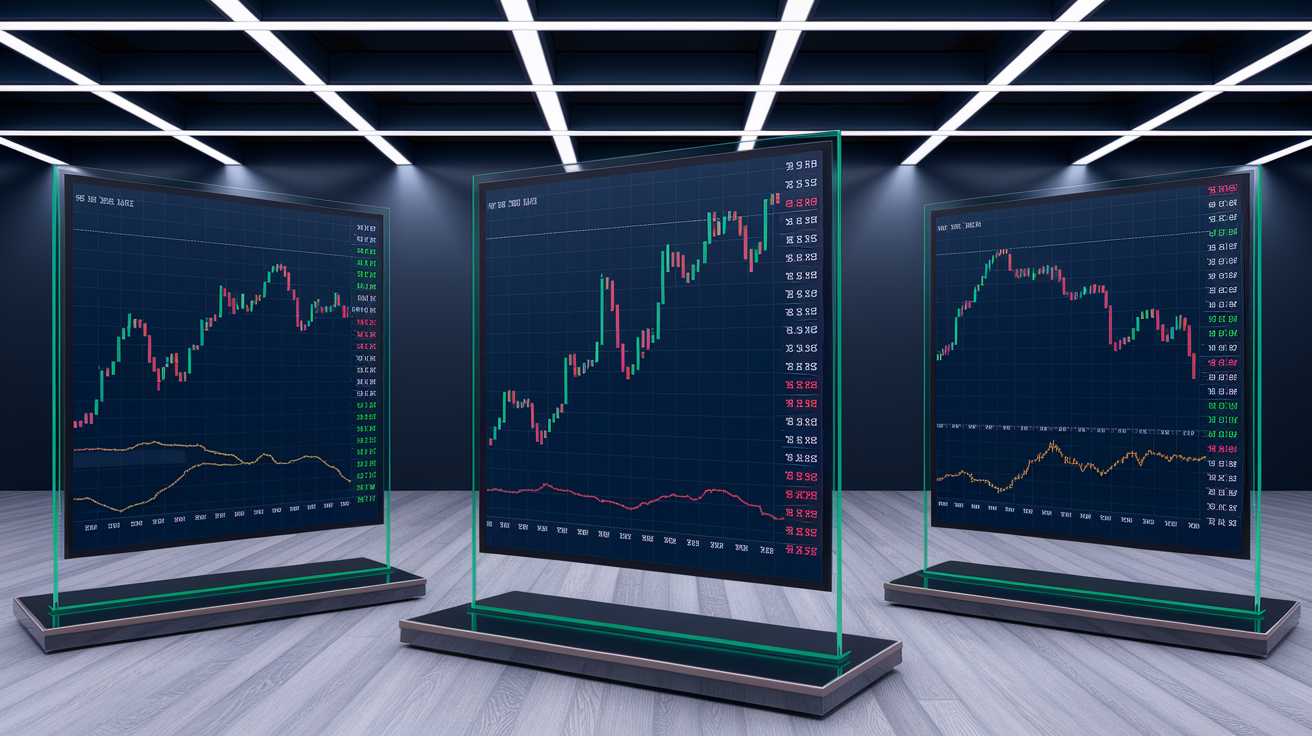
In July 2024, EUR/USD opened at 1.0744 after gapping from 1.0713, then printed a bullish engulfing candle on the daily chart with strong volume. Traders who entered long above the engulfing high captured a 4.35% rally to 1.1175 over the following seven weeks. The setup worked because the gap was confirmed by a clean daily candlestick, volume was elevated, and the pair held above the 20-day EMA throughout the move. The stop sat below the engulfing low near 1.0710, giving tight risk/reward at the start of a multi-week trend.
After a corporate earnings release, one large-cap tech name gapped down 6% on disappointing guidance. Early in the session, price bounced toward the gap zone, forming a shooting star on the 15-minute chart with a long upper wick and elevated volume. Traders who shorted below the shooting star low, with stops above the wick high, caught another 3% decline as the gap continued to widen. The key was waiting for the failed bounce (a shooting star confirmation) rather than shorting blindly into the gap at the open.
A small-cap stock gapped up 8% on a surprise earnings beat, then consolidated in a tight inside-bar pattern on the daily chart for the next two sessions. On day three, price broke above the inside-bar high on 3× average volume. Swing traders entered the breakout with stops below the inside-bar low and rode the position for an additional 12% gain over two weeks. The inside bar compressed volatility after the initial gap, and the breakout candle confirmed that institutions were accumulating, not distributing.
| Example Scenario | Candlestick Pattern | Outcome |
|---|---|---|
| EUR/USD July 2024 gap-up from 1.0713 to 1.0744 | Daily bullish engulfing with volume confirmation | 4.35% rally to 1.1175 over seven weeks; stop below engulfing low held |
| Large-cap tech gap-down 6% on guidance miss | 15-min shooting star after failed bounce | Additional 3% decline after short entry below shooting star low |
| Small-cap 8% gap-up, then 2-day inside bar | Daily inside-bar breakout on 3× volume | 12% continuation over two weeks; stop below inside-bar low never tested |
| Mid-cap gap-down into prior support, hammer forms | 60-min hammer at gap-fill zone with volume absorption | Reversal long captured 5% bounce back toward gap high within three sessions |
Final Words
Market opens on a gap and the first candles decide if it’s real or a fade.
This post listed the most reliable candlestick setups for earnings gaps, showed how to read gap context and volume, and walked through entry/exit rules, timeframe choices, and risk stops. Real chart examples tied the rules to what you’ll actually see.
Keep clear levels, an invalidation line, and small size. Use candlestick setups for earnings gap plays with discipline and you’ll trade cleaner and stay protected.
FAQ
Q: What is the 3 5 7 rule in trading?
A: The 3-5-7 rule in trading uses 3-, 5-, and 7-period checks across timeframes: 3 for trigger, 5 for structure, 7 for trend confirmation. Use clear levels and a stop to invalidate the idea.
Q: How to trade earnings gap up?
A: To trade an earnings gap up, treat it as gap-and-go or a fade: check gap size and premarket volume, wait for candlestick confirmation, enter on follow-through, stop below the gap or recent wick.
Q: Can I make $100 a day daytrading?
A: Making $100 a day daytrading is possible but depends on capital, edge, win rate, and risk per trade; focus on repeatable setups, defined stops, sensible position sizing, and consistent execution.
Q: What is the 3 candle rule?
A: The 3 candle rule is a confirmation method that requires three consecutive candles in the trade direction with supporting size and closes; the setup is invalidated if an opposite close breaks the pattern.