


Think month-end swings are just rebalancing noise?
Often they’re the output of a different engine: options expirations forcing dealer hedging that amplifies every tick.
Dealers who sold options hedge by buying or selling the underlying to stay delta-neutral, and as expiration nears gamma (how fast an option’s delta changes) collapses their hedges can flip from dampers to accelerators.
When expiration lands at month-end, dealer hedging, heavy open interest, and institutional rebalances collide in a tight window, creating outsized volatility in the final 24–48 hours.
How Month-End Options Expirations Drive Volatility

Month-end options expirations create concentrated volatility because contracts expire all at once, forcing traders to close, roll, or let positions settle. Standard monthly options expire on the third Friday of each month. When that Friday lands near the end of a calendar month, weeks of accumulated open interest unwind in a compressed window. Traders who held calls or puts must decide: close, roll to the next cycle, or let the position expire and accept assignment. This decision funnel drives heavy volume in the final 24 to 48 hours before expiration. That volume translates directly into price swings. The underlying has to absorb hundreds of thousands or even millions of shares traded solely to satisfy hedging and settlement mechanics, not fundamental news.
Dealer hedging flows shift aggressively as gamma exposure decays into expiration. Dealers who sold options maintain delta-neutral books by buying or selling the underlying stock to offset the directional exposure of their short options. In the weeks leading to expiration, gamma is high. Dealers adjust hedges frequently and in large size. As expiration approaches, time value collapses and gamma falls off a cliff. Dealers who were buying into rallies and selling into dips suddenly stop that stabilizing activity. If they flip to negative gamma because they’re short options near the money and the stock is moving, they now hedge with the move. Buying as the stock rises and selling as it drops. That amplifies price swings instead of dampening them, turning modest moves into sharper spikes or drops in the final hours.
OPEX cycles follow a predictable rhythm. Most monthly expirations occur on the third Friday, and institutions cluster positioning around these dates because they align with fund mandate deadlines, quarterly rebalances, and risk-management reviews. Institutional desks know that liquidity and volatility both spike into expiration, so they time their rolls, unwinds, and new-position entries accordingly. When month-end and OPEX land in the same week, the flows overlap. Portfolio managers rebalancing for calendar-month performance while options traders unwind expiring contracts. The combined order flow can overwhelm normal market depth. The result is wider intraday ranges, faster moves, and heavier volume in the final trading hours.
These combined mechanics produce heightened end-of-month volatility because they converge in time and direction. Expiring contracts force decisions. Gamma decay removes the shock absorbers that normally stabilize price. Institutional flows add directional pressure on top of dealer hedging. The market becomes more sensitive to every tick, every headline, and every size order, making the final day before expiration a minefield for undisciplined traders and an opportunity for those who understand the timing and flows. The closer you get to the last two hours before the close, the more pronounced these effects become. Dealers rush to flatten exposure and traders scramble to avoid assignment or lock in profits.
Gamma Exposure and Its Influence on Price Behavior

Gamma measures how fast an option’s delta changes as the underlying price moves. Think of delta as the current exposure, how many shares an option behaves like, and gamma as the speed at which that exposure accelerates or decelerates. High gamma means delta is sensitive. A $1 move in the stock can swing delta by 0.10 or more, forcing rapid hedge adjustments. Low gamma means delta is stable. At-the-money options carry the highest gamma, especially as expiration nears, because they’re right on the edge between in-the-money and out-of-the-money. That edge is where uncertainty and hedging volume is greatest. Dealers who sold ATM options face the most gamma risk, and that risk translates into heavy underlying trading as they try to stay delta-neutral.
Positive gamma forces dealers to trade against the move, which smooths volatility. When the stock rises, a dealer short calls sees delta increase, so they buy shares to hedge. When it falls, delta drops, so they sell shares. This “buy low, sell high” behavior acts like a damper on price swings. Negative gamma does the opposite. Dealers hedge by buying into strength and selling into weakness, amplifying moves. If a dealer is short puts and the stock drops, delta on the puts increases, becomes more negative, so the dealer must sell more shares to stay hedged. That selling pushes the stock lower, which increases delta further, triggering more selling. A feedback loop that turns small dips into sharp drops. Near expiration, gamma exposure can flip from positive to negative as OTM options lose value and ITM options become fully hedged, and that flip changes the entire character of intraday price action.
Gamma decays sharply as expiration approaches, collapsing the most in the final week and especially the last 48 hours. Far from expiration, gamma is spread across time and strikes, so its influence is diffuse. Close to expiration, gamma concentrates at ATM strikes and evaporates everywhere else. This creates a liquidity trap. Dealers who were actively hedging suddenly have nothing to hedge because options are expiring worthless or fully ITM, so they unwind their stock positions all at once. That unwind floods the market with buy or sell orders in a narrow time window, often in the last two hours of the expiration day. The underlying absorbs this flow with limited depth, and the result is sharp, non-directional price swings that feel random but are entirely mechanical.
Specific market behaviors that shift as gamma exposure weakens near month-end:
Intraday ranges widen even without new fundamental catalysts, as hedging flows dominate price discovery. Bid-ask spreads on options expand, especially for strikes far from the current price, reflecting collapsing gamma and liquidity. Volume spikes in the final hour, concentrated in the underlying rather than the options, as dealers flatten exposure. Price gravitates toward strikes with heavy open interest, as dealers hedge ATM gamma aggressively and avoid assignment. Post-expiration gaps become common on the following Monday, when hedges clear and directional positioning reasserts itself.
Pin Risk and Price Gravitation Near Strike Levels

Pin risk describes the tendency for stock prices to gravitate toward heavily traded strike prices as expiration approaches. It’s not conspiracy or manipulation. It’s a natural outcome of dealer hedging mechanics and assignment avoidance. When open interest is concentrated at a specific strike, dealers who are short options at that level have a strong incentive to keep the stock near that strike at expiration. If the stock closes exactly at the strike, ATM options expire worthless, no assignment, and dealers can unwind their hedges cleanly without taking on unwanted stock positions. If the stock drifts away from the strike, dealers face assignment risk and must either accept delivery or scramble to hedge, both of which are costly. So dealers trade the underlying to nudge price back toward the pin point, creating a magnetic effect. The closer to expiration, the stronger this pull becomes, especially in the final two hours when hedging urgency peaks.
High open interest at a strike amplifies the pin effect because it represents more contracts and therefore more shares at stake. For example, if 25,000 call contracts are open at a $100 strike, that’s 2,500,000 shares of potential exposure. As the stock approaches $100 in the final hours before expiration, dealers who sold those calls must hedge by buying or selling shares to keep delta neutral. If the stock is at $99.90, dealers might buy shares to push it toward $100 to avoid expiring in-the-money by a hair. If it’s at $100.10, they might sell shares to pull it back. This hedging activity creates a tight, choppy range around the strike, trapping price for hours and frustrating directional traders. The range often stays compressed until the final 15 to 30 minutes, when dealers unwind hedges rapidly and price can break free. Or not, depending on whether new positioning has already set up for the next cycle.
Institutional Positioning and End-of-Month Rebalancing Dynamics

Institutional portfolio managers adjust equity exposure at month-end based on performance mandates, risk limits, and benchmark tracking rules. If a fund is overweight equities relative to its target allocation, it must sell stocks to rebalance. If it’s underweight, it buys. These adjustments aren’t discretionary. They’re driven by policy, compliance, and client mandates, and they’re typically executed in the final days of the month to lock in performance numbers and reset risk for the next period. When month-end falls near or on an OPEX Friday, these rebalancing flows hit the market at the same time dealers are unwinding options hedges. The combined flow can be enormous. Dealer hedging might represent millions of shares from gamma unwinds, and institutional rebalancing can add millions more from equity-weight adjustments, creating a liquidity crunch that amplifies volatility.
These flows interact in unpredictable ways. If institutions are net sellers at month-end and dealers are unwinding long hedges because short puts expired, both flows sell into the market simultaneously, overwhelming bids and driving sharp drops. If institutions are buyers and dealers are covering short hedges because short calls expired, the combined demand can spark short-covering rallies that look like breakouts but evaporate the following week. The timing matters. Institutional rebalancing often clusters in the final hour to capture closing prices for NAV calculations, which overlaps precisely with the dealer hedging rush before the 4:00 PM close. That overlap compresses liquidity, widens spreads, and makes execution unpredictable. Limit orders that looked safe at 3:30 might not fill by 4:00, and market orders can suffer heavy slippage.
Intraday liquidity becomes brittle as rebalancing and OPEX flows converge. Market makers widen spreads to protect against adverse selection, knowing that large institutional orders and dealer unwinds are coming but not knowing the direction or size ahead of time. Volume surges but depth shrinks. Large orders move price more than they would on a normal day. High volume makes the market look liquid, but every transaction has outsize impact. Traders who ignore this dynamic and size positions normally get chopped up by intraday whipsaws, stop-outs, and slippage. The cleanest play is often to wait until after expiration and rebalancing settle, then trade the follow-through move on Monday when flows normalize and positioning resets.
Four common institutional rebalancing triggers at month-end:
Target-weight rebalancing. Funds mechanically buy or sell to restore equity/bond allocations to mandate targets after monthly mark-to-market valuations.
Performance-driven adjustments. Managers lock in gains or cut losers before month-end NAV snapshots to avoid carry-over P&L into the next period.
Risk-parity rebalancing. Volatility-targeting strategies increase equity exposure after quiet months and reduce it after volatile periods, often executing at month-end.
Index-fund reflows. Passive funds adjust holdings to match index-constituent weights after monthly reconstitutions, additions, or deletions, creating concentrated single-stock flows.
Historical Examples of Month-End OPEX Volatility
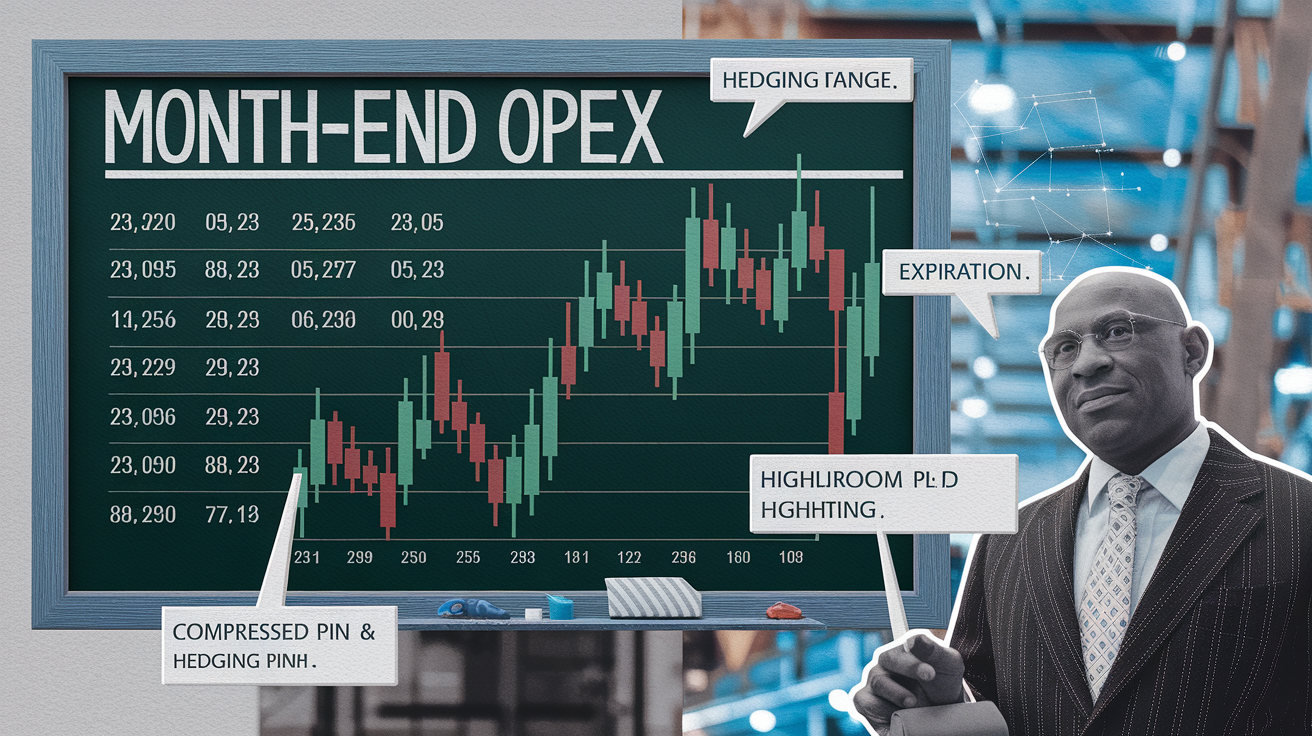
June 2024 month-end OPEX showed how Juneteenth holiday shifts and heavy call open interest combined to pin SPY in a narrow range into expiration. SPY had over 400,000 combined calls and puts at the $450 strike expiring on Friday, June 21, and the stock traded between $449.80 and $450.20 for the final two hours. Dealers hedged aggressively to avoid assignment, buying dips and selling rips to keep price locked near $450. Volume in the final hour was triple the average, but the range stayed compressed until the last 10 minutes. Then dealers unwound hedges and SPY broke out to $450.60 by the close. The following Monday, with expiration flows cleared, SPY gapped up $2 on no fundamental news. Classic post-OPEX release of pent-up directional pressure.
March 2022 month-end OPEX coincided with Federal Reserve rate-hike uncertainty and heavy put open interest in index options. The VIX was elevated above 25, and negative gamma dominated dealer positioning. Hedging flows amplified price moves instead of dampening them. SPX dropped 2% in the final 90 minutes of expiration Friday as dealers sold to hedge short puts that moved deeper ITM, creating a feedback loop. Retail traders chasing the drop got trapped as the selling exhausted into the close, and the market reversed sharply the next trading day. The key mechanism was negative gamma turning a modest drift into a capitulation cascade, all driven by hedging math, not new information.
October 2021 month-end OPEX saw the opposite effect. A gamma squeeze in meme stocks that carried into month-end close. High call open interest in AMC and GME forced dealers short those calls to buy shares as prices rose, and the hedging flow pushed prices higher, which triggered more hedging. A positive feedback loop. The underlying stocks showed intraday volatility exceeding 10%, and volume in the final hour was five to ten times normal. The rally exhausted immediately after expiration as dealers unwound long hedges, and both stocks dropped 15% the following week. OPEX can amplify moves in both directions depending on the sign of dealer gamma and the concentration of open interest.
| Event Date | Market Impact | Key Mechanism |
|---|---|---|
| June 21, 2024 | SPY pinned at $450 for final 2 hours, then $2 gap up Monday | Dealer hedging to avoid assignment at heavy OI strike; post-expiration hedge unwind |
| March 18, 2022 | SPX dropped 2% in final 90 minutes, reversed next day | Negative gamma amplified selling as dealers hedged short puts; feedback loop into close |
| October 29, 2021 | AMC/GME intraday volatility >10%, 15% drop post-expiration | Gamma squeeze forced dealer buying into expiry; hedge unwind collapsed prices after |
Final Words
Into month-end, expiring options concentrate volume and force dealers to adjust hedges, so price gets twitchy and small orders move the market.
Gamma decay, pin risk around heavy strikes, and institutional rebalancing can line up and amplify those moves. The post breaks down the mechanics, dealer flows, and historical examples so you can see why that happens.
Use the framework to mark levels, set stops, and size trades. This is how options expirations create end-of-month volatility, and with a plan you can trade it calmly.
FAQ
Q: Do options expire at the end of the month?
A: Options expire on specified expiration dates: many monthly contracts do expire near month‑end, but standard US equity options usually expire the third Friday; check each contract—weeklies, quarterlies, and LEAPS differ.
Q: Why do 90% option traders lose money?
A: The reason 90% of option traders lose money is poor risk control, oversized positions, chasing high‑risk plays, ignoring time decay and Greeks, and trading without a repeatable plan or proper sizing.
Q: What happens to the market when options expire?
A: When options expire the market often sees concentrated volume, dealer hedge adjustments, gamma decay and pin risk, which can spike intraday volatility and nudge prices toward heavily traded strikes.
Q: How are options settled on the expiry date?
A: Options are settled on expiry by exercise or assignment: most equity options settle physically (underlying changes hands), index options often cash‑settle, with automatic exercise for in‑the‑money contracts based on final settlement prices.